Physical Address
304 North Cardinal St.
Dorchester Center, MA 02124
Physical Address
304 North Cardinal St.
Dorchester Center, MA 02124

COBOL Trace in PeopleSoft follows a process similar to configuring traces in App Engine or SQR.
Here’s a step-by-step breakdown:
1-Step : Select the COBOL program to set a trace
2–Step : Copy Trace parameter
3-Step : Apply Copied trace in process Definition
4-Step : Run the Cobol program
The first step is to identify the specific COBOL program for which we want to enable tracing. For testing, I have chosen a simple COBOL Program in the below navigation
Navigation : Main Menu > peopletools > process Scheduler > System Process request

In the second step, we should collect the trace parameters necessary for configuring the trace. These parameters will be applied within the process definition of the chosen COBOL program
Navigation : Main Menu > peopletools > process Scheduler > Process types

Unlike App Engine, you won’t need to memorise trace parameters, as they are readily available within the process type. Click on the “Search” button to access them. The parameter list is easily accessible for copying.

Now we have to apply the parameter in the process definition
Navigation : Main Menu > peopletools > process Scheduler > Process > “Process Name” >Override option
Similar to App Engine, navigate to “Processes” and select the appropriate process name. In the “Overwrite Options” section, insert your trace parameters. We have to make sure that the parameter list is set to override, because we usually give append, in SQR and App Engine trace configurations.
The next consideration is the trace number. Like App Engine, determine an appropriate number based on your trace requirements. For instance, you may choose a number like 135, signifying different trace options (128 + 4 + 2 + 1).
| BIT | Type of tracing |
| 1 | SQL statements |
| 2 | SQL statement variables |
| 4 | SQL connect, disconnect, commit and rollback |
| 8 | Row Fetch (indicates that it occurred, not data) |
| 16 | All other API calls except ssb |
| 32 | Set Select Buffers (identifies the attributes of columns to be selected). |
| 64 | Database API specific calls |
| 128 | COBOL statement timings |

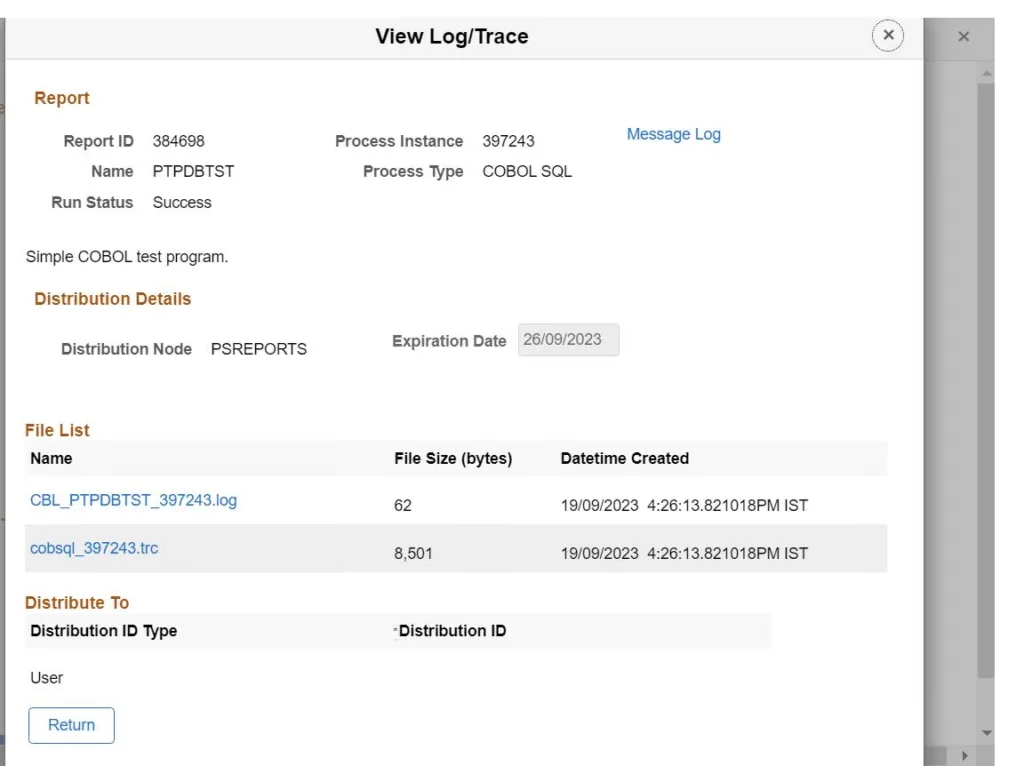
The fourth and final step is to execute the COBOL program with the configured trace settings. This step involves running the program. After running the program, verify if it has generated any trace output.
I hope you learn how to do COBOL Trace in PeopleSoft. click here to learn how to make trace in application engine

Finally, execute the programme. Once the process runs successfully, examine whether it has generated a trace. Typically, you can locate the trace file, which contains the COBOL trace information, including statement timings and SQL statements.